
Curtailment
From the operator’s public data to the decision of when to stop each machine.
Public data · platform paused
The live demo is paused for a while. To learn more, talk to me.
- Machine data
- Learning
- Decision under failure
The problem
On screen, curtailment and failure look alike.
The sector
Over half of wind half-hour records had curtailment.
51%
wind
34%
solar
How it is built today
From data to decision, checked.
public data
group
separate curtailment from failure
forecast 48 h
choose the hour
the result comes back measured
- checked outside the systemspreadsheet and MATLAB
- tested every nightuntil the pause
- delivered in a containerDocker
The screens
Four questions, four screens.
 (opens in a new tab)
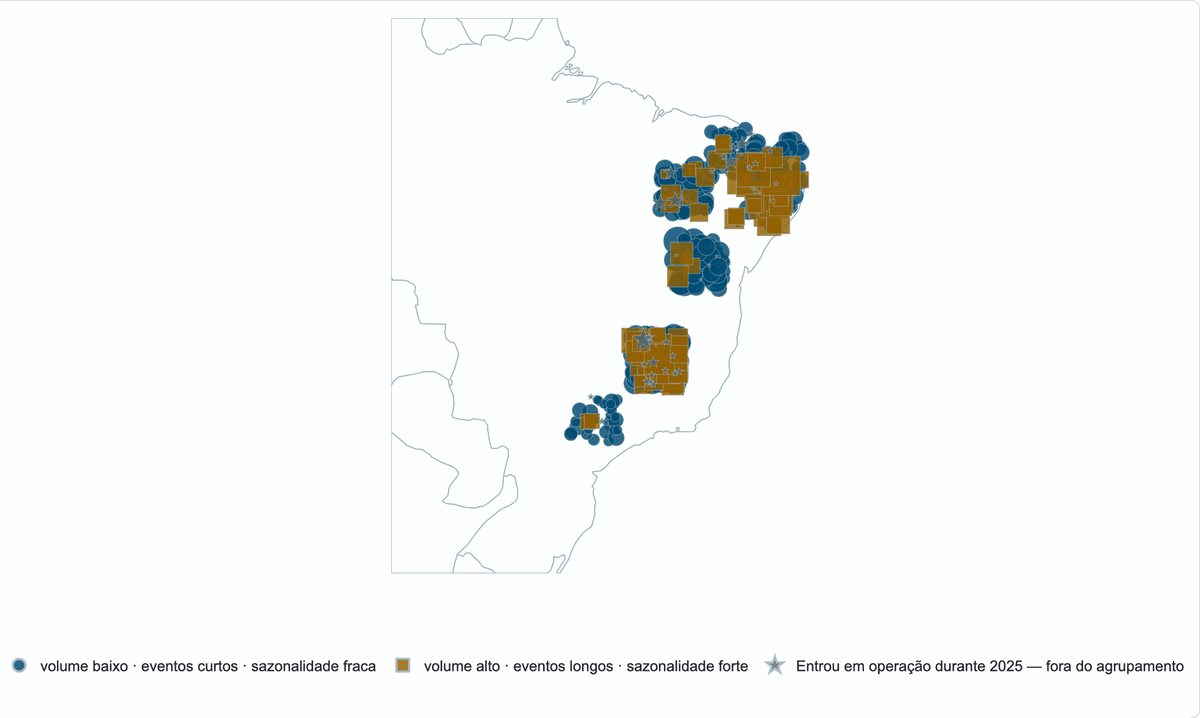
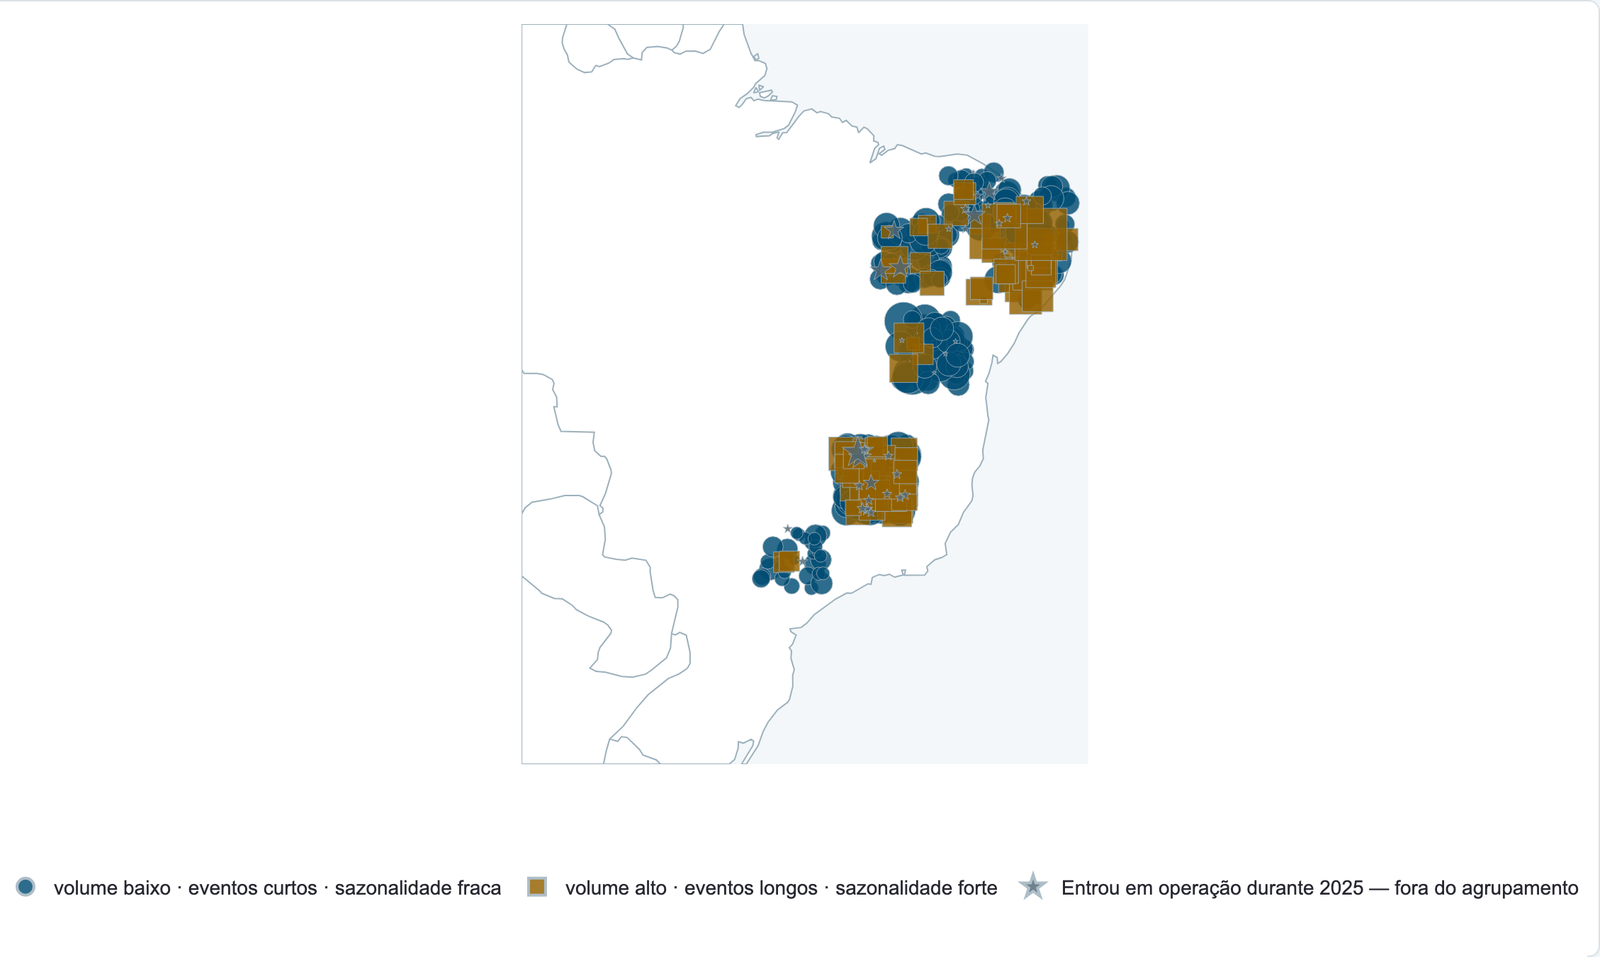
Where and when does curtailment happen?
Solar plants curtailed in 2025, grouped by curtailment profile.
 (opens in a new tab)
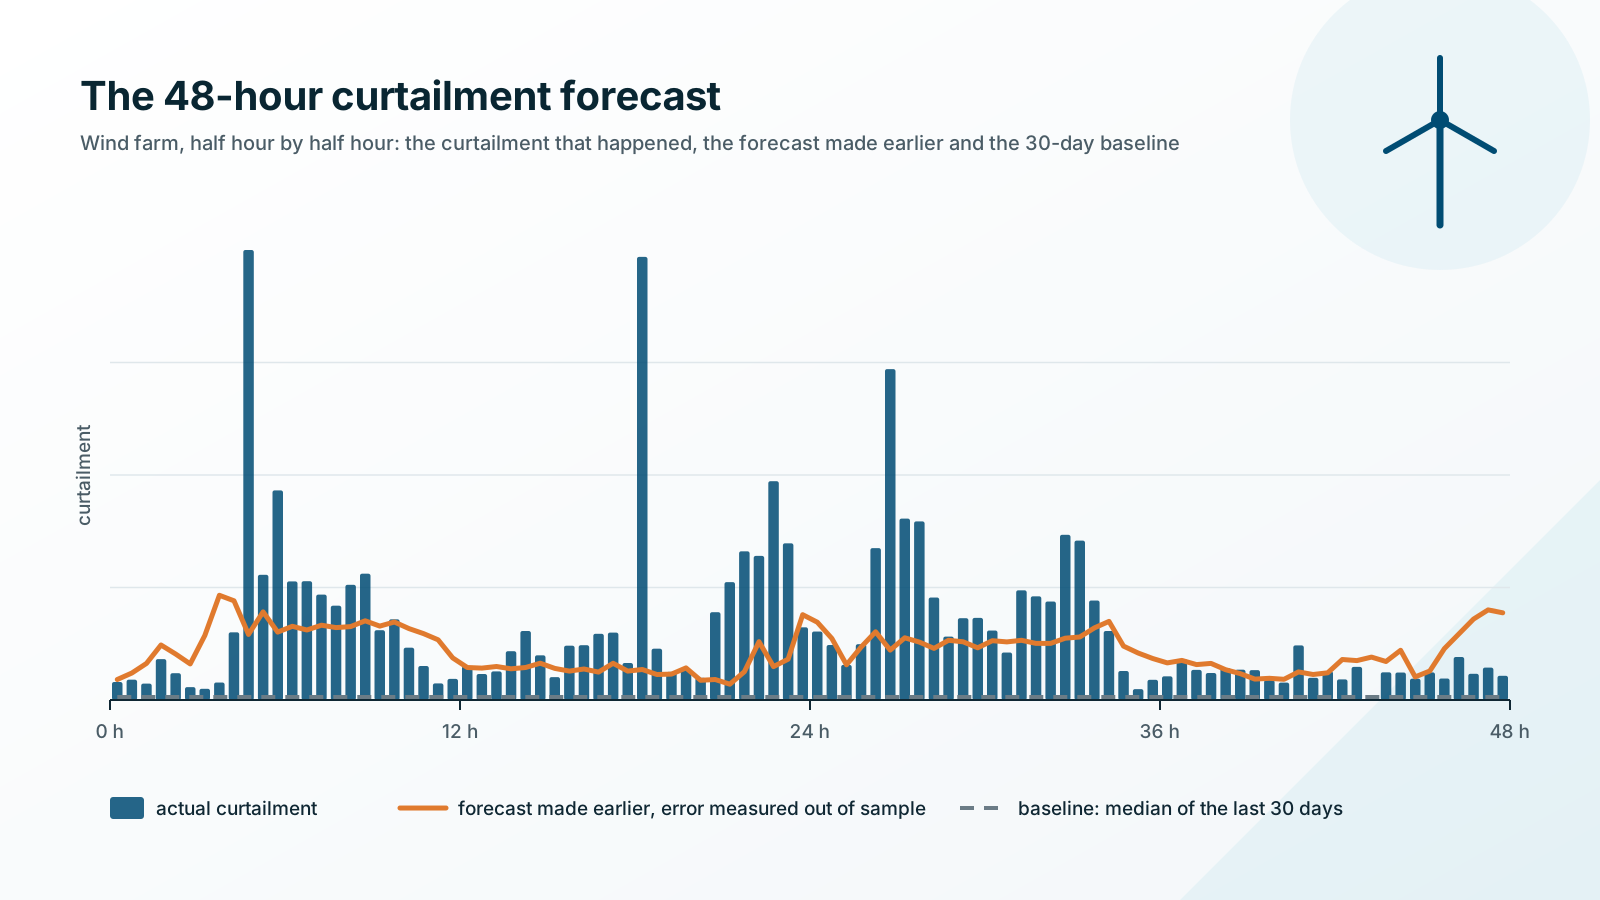
Does the forecast err less than the baseline?
48 hours: the curtailment, the forecast made earlier and the 30-day baseline.
 (opens in a new tab)
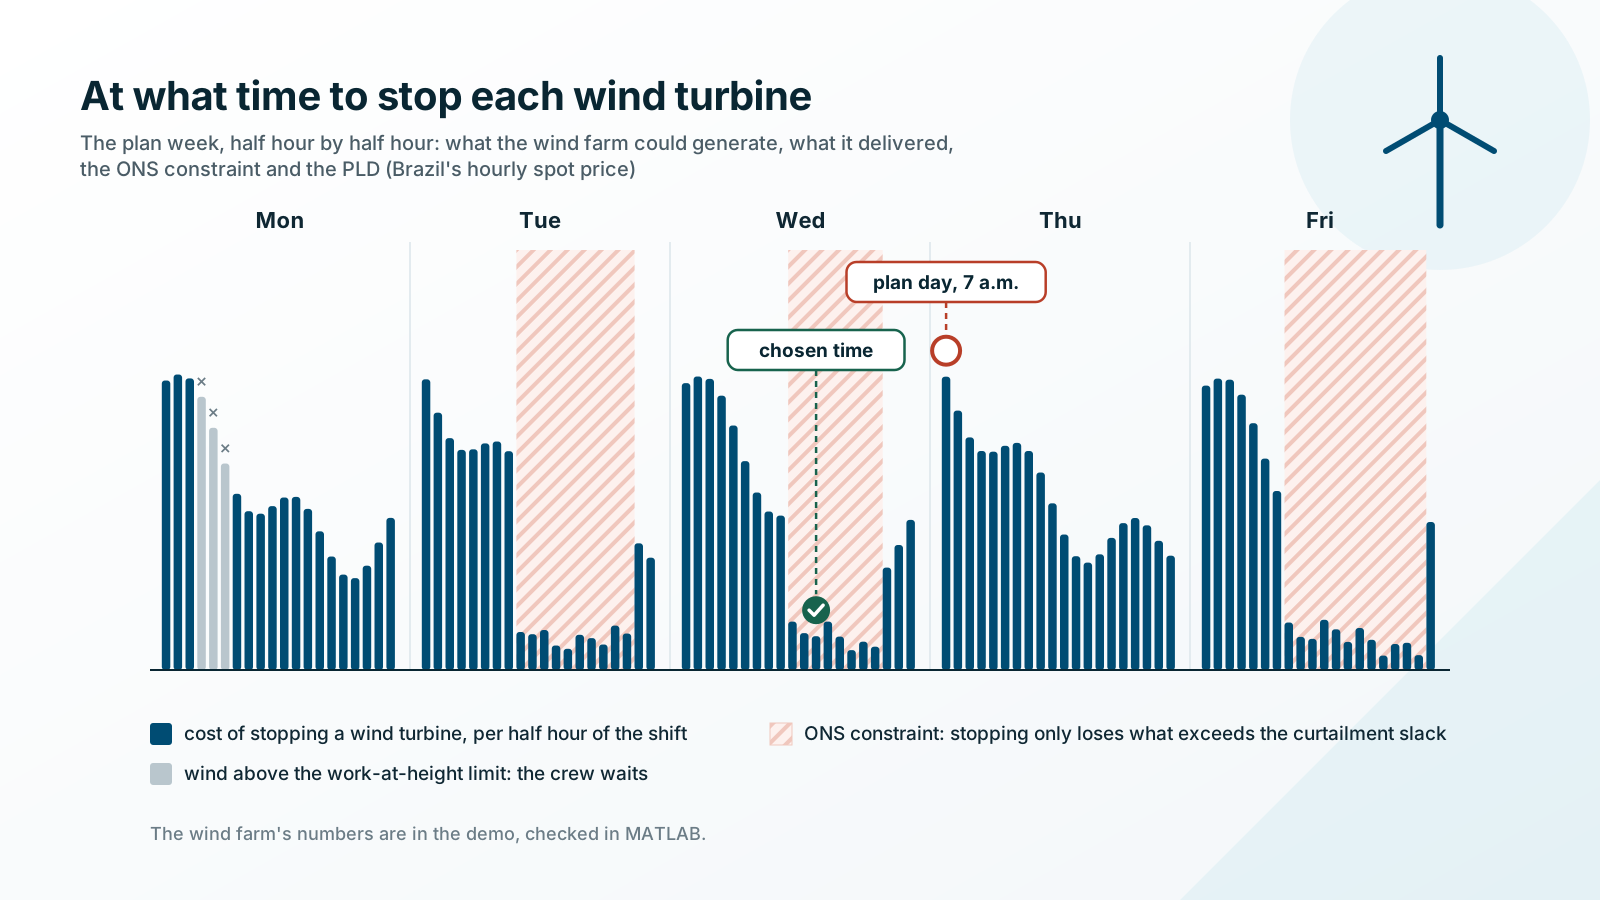
At what hour to stop?
The plan week: the cost of stopping, the constraint and the chosen hour.
 (opens in a new tab)
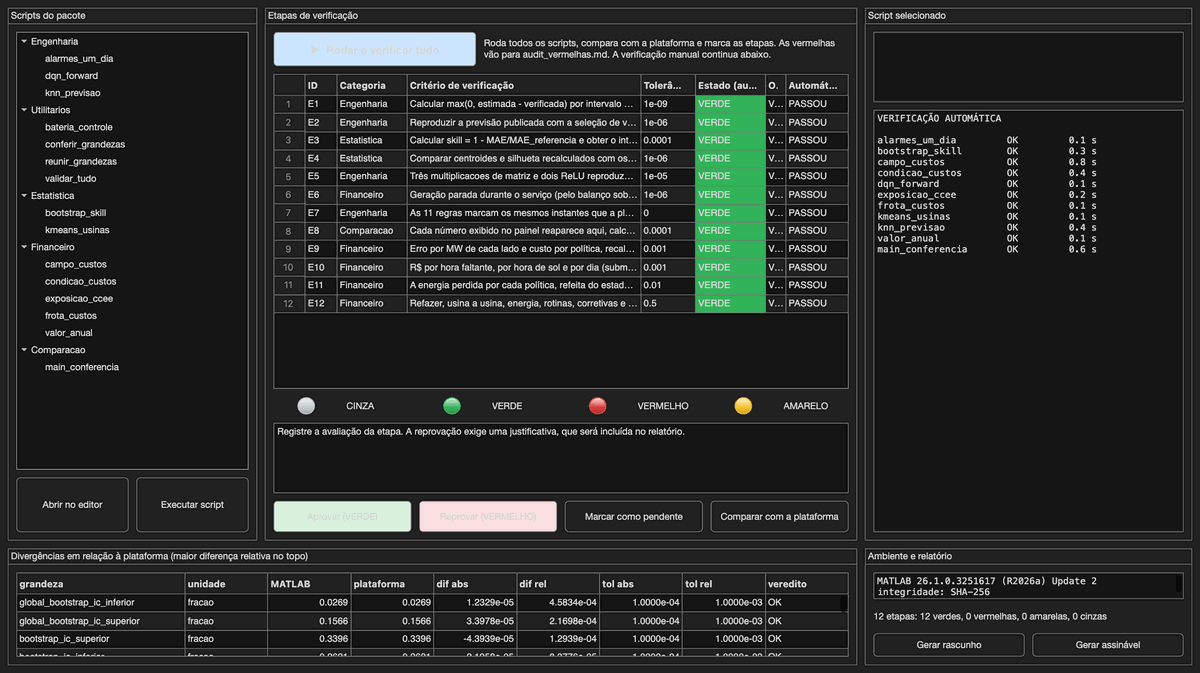
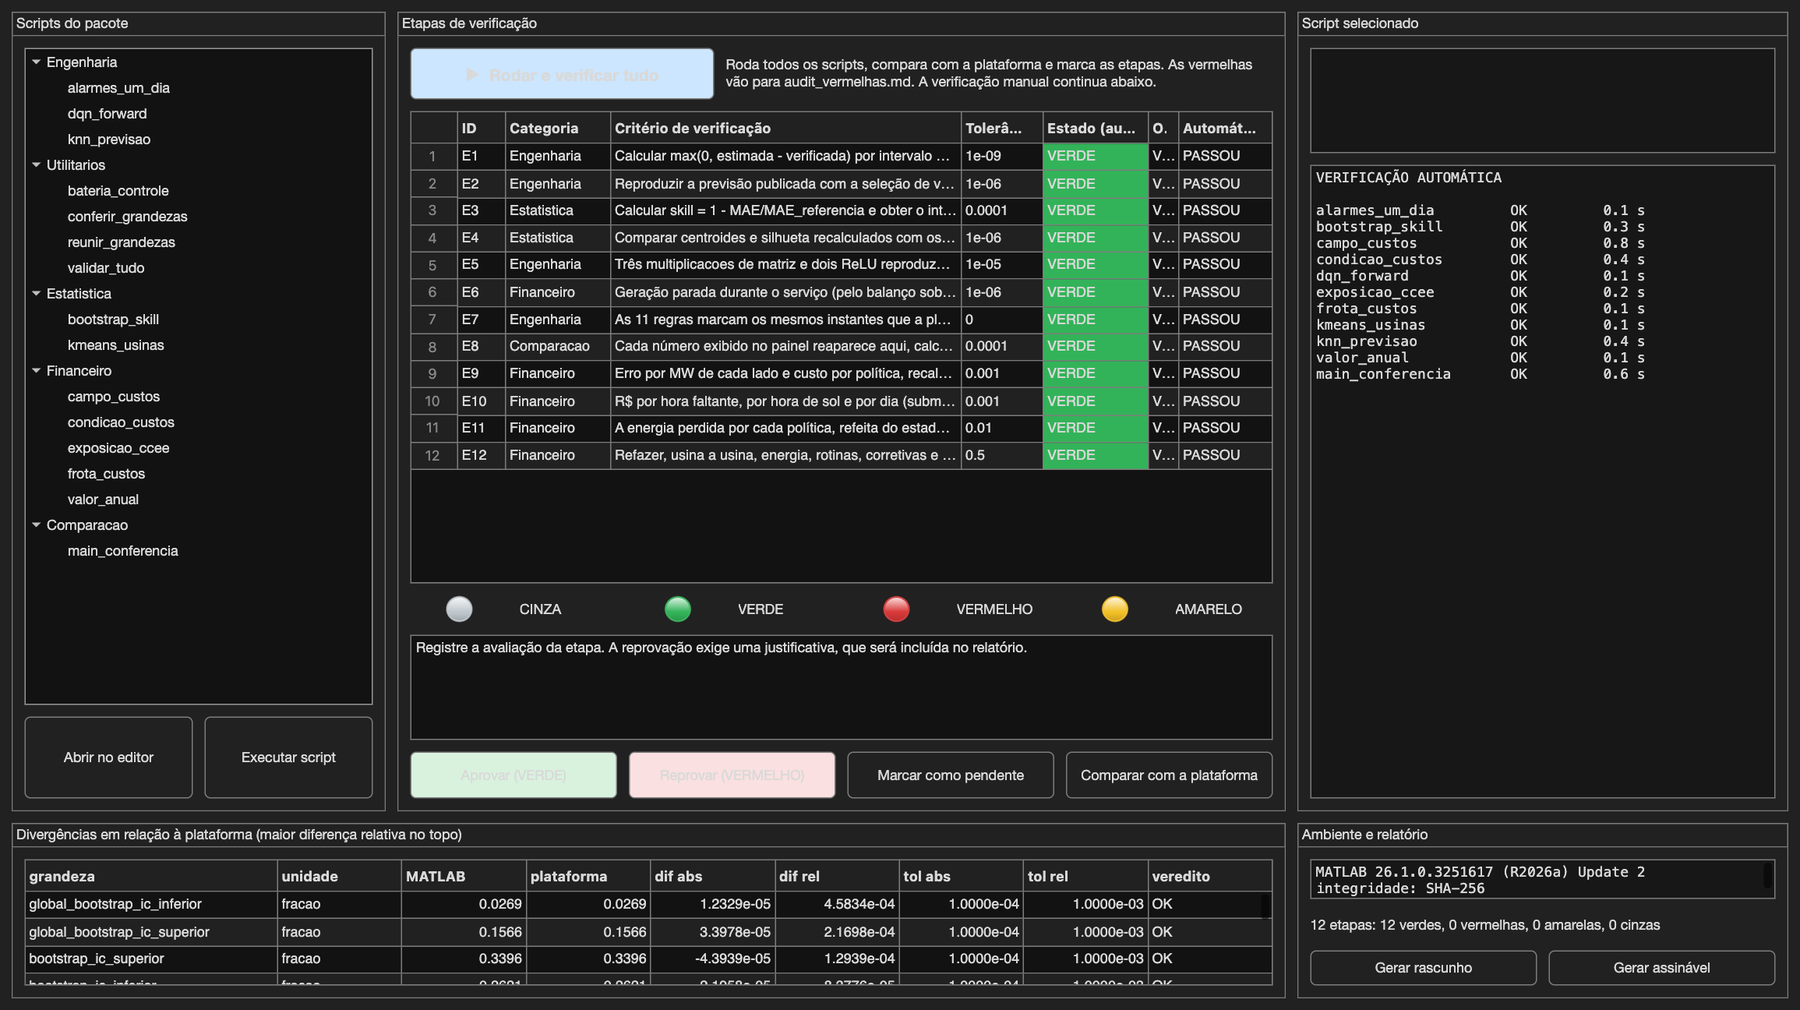
Can the published numbers be redone?
Twelve steps redone in MATLAB, all green.
Checks
The published numbers, redone outside the system.
- 1,255tests
- 236checks
- 12 of 12steps in MATLAB
Full verification on 28 September 2026.
A spreadsheet with live formulas and MATLAB scripts redo the published quantities.
Still open
- Public data and simulation: not an expert report.
- The forecast is not the product: it is the model of the process.
Tools
- ONS and CCEE open data
- k-Means
- k-NN with bootstrap
- DQN
- condition-based decision
- Python
- MATLAB R2026a
- Excel
- pytest
- Docker
- hexagonal architecture
Document
Own project · 2026 · data: ONS (opens in a new tab), wind and solar (opens in a new tab) generation constraints (CC-BY); CCEE (opens in a new tab), hourly PLD (CC-BY)