
Demo · wind curtailment
Curtailment calls for better decisions.
See how engineering can support constraint forecasting, metering checks and maintenance planning at a wind farm.
Public data from ONS (Brazil’s national grid operator) and CCEE (Brazil’s power trading chamber), half hour by half hour, from a wind farm in Brazil’s Northeast. The demo shows the method applied to a real problem. It is not the product.
I am an entrepreneur, and I fall in love with the client’s problem. I don’t start from a one-size-fits-all solution. I study the problem with your team until we find the best solution for your operation.
Restricted access, with a username and password provided by Serra Pereira.
- what it could generate
- what it delivered
- curtailment
Why it matters
Three decisions a manager makes without seeing what comes next.
When the grid cannot take the energy, ONS orders plants to reduce output. Curtailment costs generation. It also affects metering, the team and the equipment.
-
01
Will there be curtailment tomorrow, and how much?
Without a forecast, operations react after ONS orders the cut. With one, they plan the team and the asset ahead of time.
The method: a 48-hour curtailment forecast with the error measured out of sample, against the 30-day historical baseline. The scoreboard has already been rerun on the ONS wind constraint history (opens in a new tab): the same series, with wind speed in place of irradiance.
-
02
Does the settled amount match what the farm could generate?
When metering data is missing, CCEE fills the gap with an estimate. The estimate can fall below actual generation.
The method: the estimation rule in Annex 7.2 of CCEE’s Submódulo 2.1 (opens in a new tab), applied to the history with each hour’s PLD (opens in a new tab) (hourly spot price). The rule is about missing metering, not the energy source: it applies to wind just the same.
-
03
When should each wind turbine stop?
A fixed calendar ignores the condition of the equipment and the hour when stopping costs less. On a machine that needs a crane, the right hour is worth even more.
The method: condition-based decision rules compared with the calendar, with a confidence interval. At the wind farm, the demo already moves each preventive maintenance task to the hour when stopping costs less, using the farm’s own public ONS series. While the plant is constrained, stopping only loses what exceeds the curtailment slack. The wind limit for work at height and the failure rates come with their sources stated.
The size of the problem
In wind, curtailment is larger, and wind data fails less.
Serra Pereira’s count over the public ONS dataset for August 2026, record by record. The files are open: anyone can redo the math.
-
51%
of half-hour records had constrained generation
That is 1,055 wind plants and 1.57 million records in the month. Every plant in the dataset had at least one curtailment. In solar PV, in the same month, it was 34% of records and 560 plants.
Source: ONS — constrained-off operating restrictions, wind (CC-BY) (opens in a new tab)
-
0.7%
of records have faulty resource data
Wind data fails far less often than irradiance data, which comes out invalid in 10.6% of solar PV records for the same month. That changes the weight of the argument. In wind, the money is more in the curtailment itself than in missing metering.
Why it matters: the math that counts for your farm is your farm’s math. This number is a snapshot of the sector, not your exposure.
Source: ONS datasets, wind (opens in a new tab) and solar PV (opens in a new tab)
-
Same format
The dataset is a sibling of the solar PV one
Same columns, same half-hour granularity, same accounting, with wind speed in place of irradiance. That is why the method carries over from one energy source to the other without being reinvented.
What really changes: the physics of the farm and the maintenance of the machine. A wind turbine is not an inverter, and no turbine number goes on screen without a source.
Source: ONS datasets, wind (opens in a new tab) and solar PV (opens in a new tab)
How it works
Forecast to decide ahead. Measure to correct afterward.
The forecast is not the product. It is the model of the process. It exists so that the decision is made before the fact, within the limits of the asset, and checked afterward.
-
01
Forecast
Curtailment over the next 48 hours, with the error measured.
-
02
Compare options
Each hour ahead becomes a choice with a price.
-
03
Decide under constraints
The option that yields the most without exceeding the asset’s limit.
-
04
Measure results
What happened is recorded and checked.
what happened comes back measured and corrects the next decision
What already applies to wind, what is in preparation and what comes with the client’s data
| Area | Already applies to wind | In preparation | With the client’s data |
|---|---|---|---|
| Forecast | the ONS wind constraint dataset (opens in a new tab) has the same format, and the error scoreboard has already been rerun on it | the wind forecast at the farm’s location, measured against the nearest INMET weather station | farm generation, with weather and the client’s telemetry |
| Metering and CCEE | the estimation rule in Annex 7.2 of Submódulo 2.1 (opens in a new tab) does not distinguish the energy source; the PLD (opens in a new tab) is the same | — | SCDE data-origin report and metering evidence |
| Farm operations | the math that separates ordered curtailment from asset loss: the energy in each state is available minus delivered, and that does not depend on the energy source; the farm’s latest real week in the ONS data: what it could generate, what it delivered and the wind | — | the farm’s SCADA and the alarms the client already uses |
| Maintenance | preventive maintenance at the hour of least loss, on the farm’s real ONS series and the PLD for that hour, with the wind limit for work at height and failure rates from public sources | condition-based management with the farm’s failure history | real machine signals and a link to the forecast |
| Cross-check | Excel and MATLAB recompute the published quantities, with the stated scope; the wind field study is already recomputed in MATLAB and in Python | the full package recomputed for the wind farm | physical condition of the real asset |
The demo
Each screen answers one question.
Each indicator shows its data source and its method. Anything simulated is marked as simulated.
Since September 2026, the demo also answers what curtailed energy can become, at what price, how long it takes to pay back, how long until it produces and how many hours a year it operates. All with the stated rule, a downloadable spreadsheet with live formulas, and per-user access with permissions per tab.
The images below are from the solar PV demo, or diagrams where the numbers stay in the demo only. The wind version uses the same screens on the wind farm’s ONS series, and its field study already runs on the real data.
-
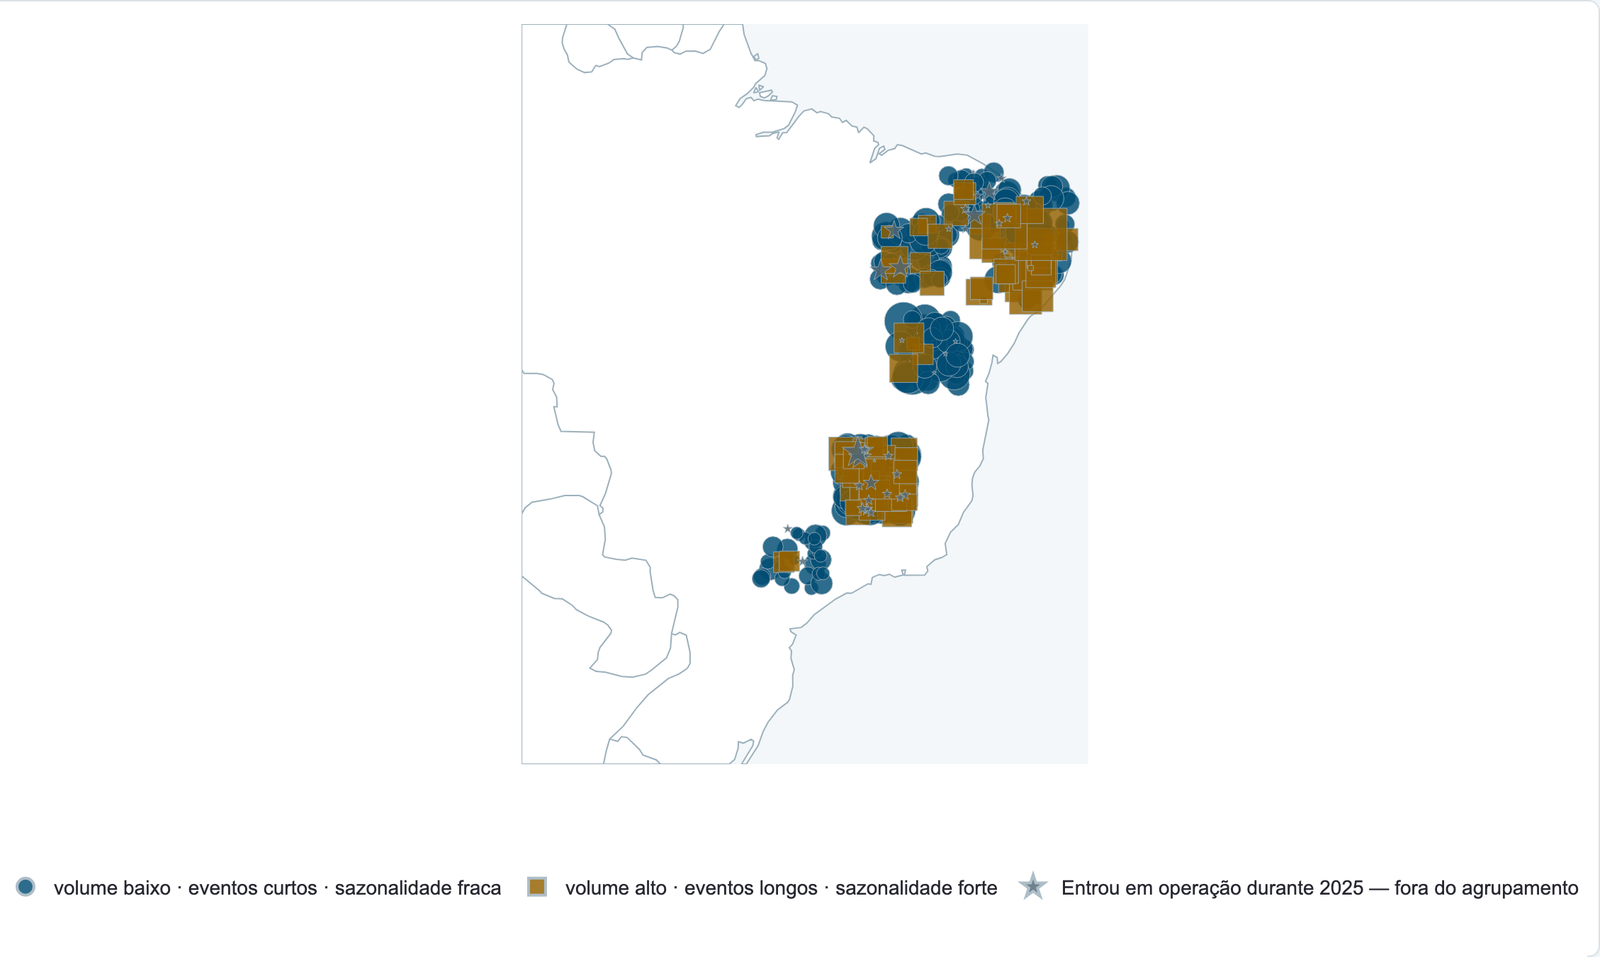
Solar PV demo · screen in Portuguese
Where and when does curtailment happen?
The public ONS history, by plant, by hour and by season. The wind constraint (opens in a new tab) dataset has the same format as the solar PV (opens in a new tab) one, with wind speed in place of irradiance. That is why this screen changes energy source without changing method.
-
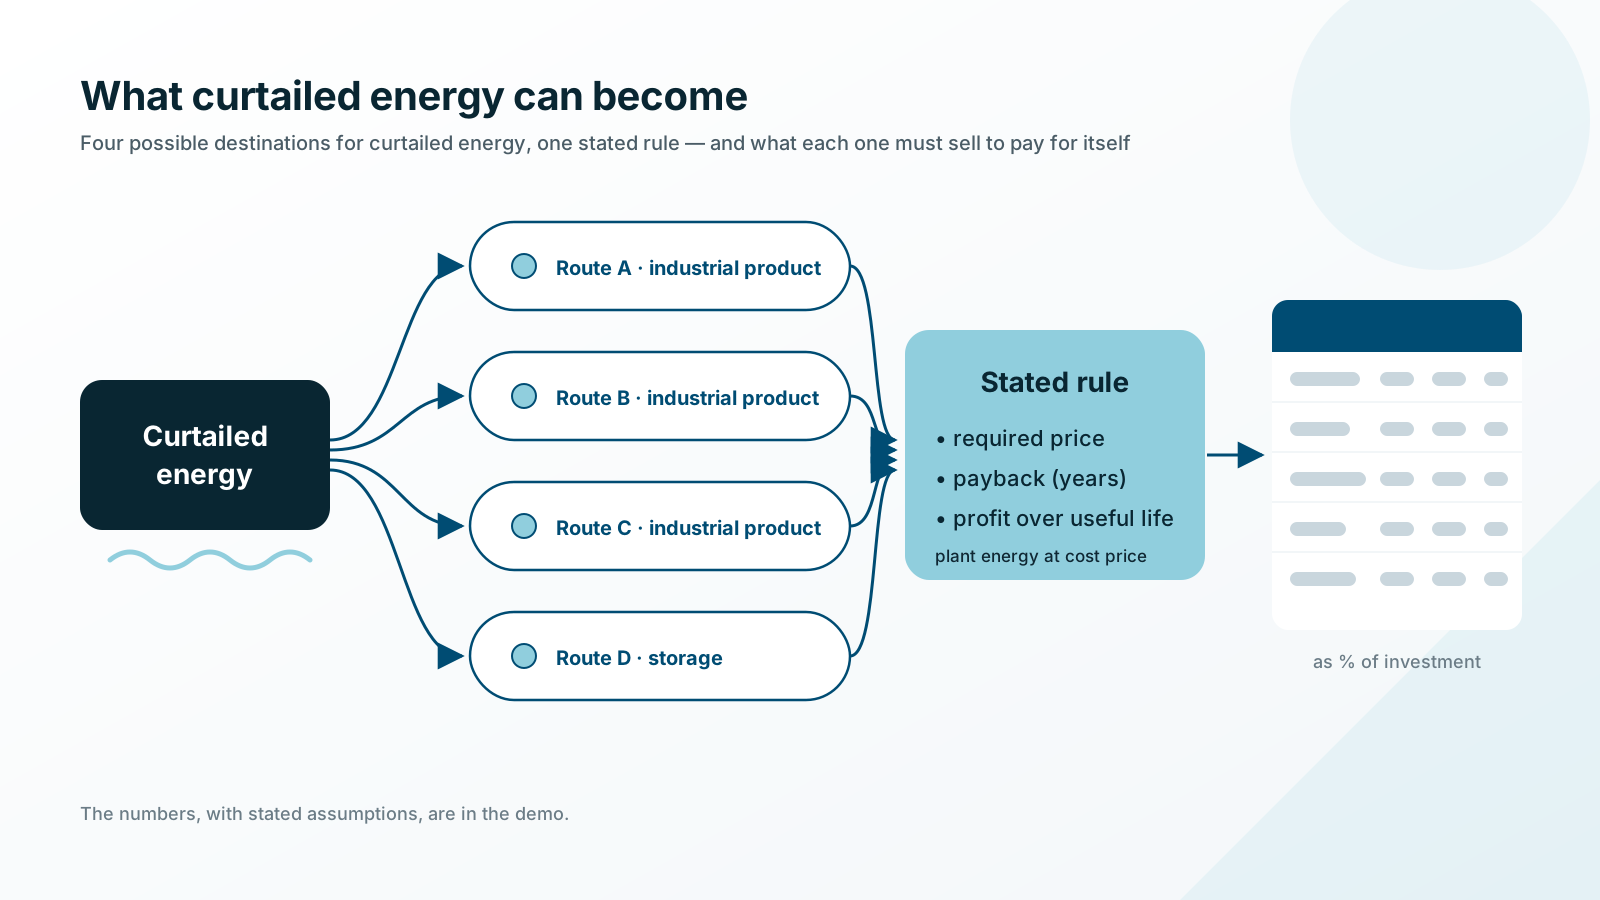
Diagram · numbers in the demo
What can curtailed energy become?
Four routes for curtailed energy: industrial products and storage. The rule is stated in the demo: a second company and plant energy at cost price. The table shows what each route must sell, how long it takes to pay back and how much profit it makes over its useful life, as a percentage of investment.
-
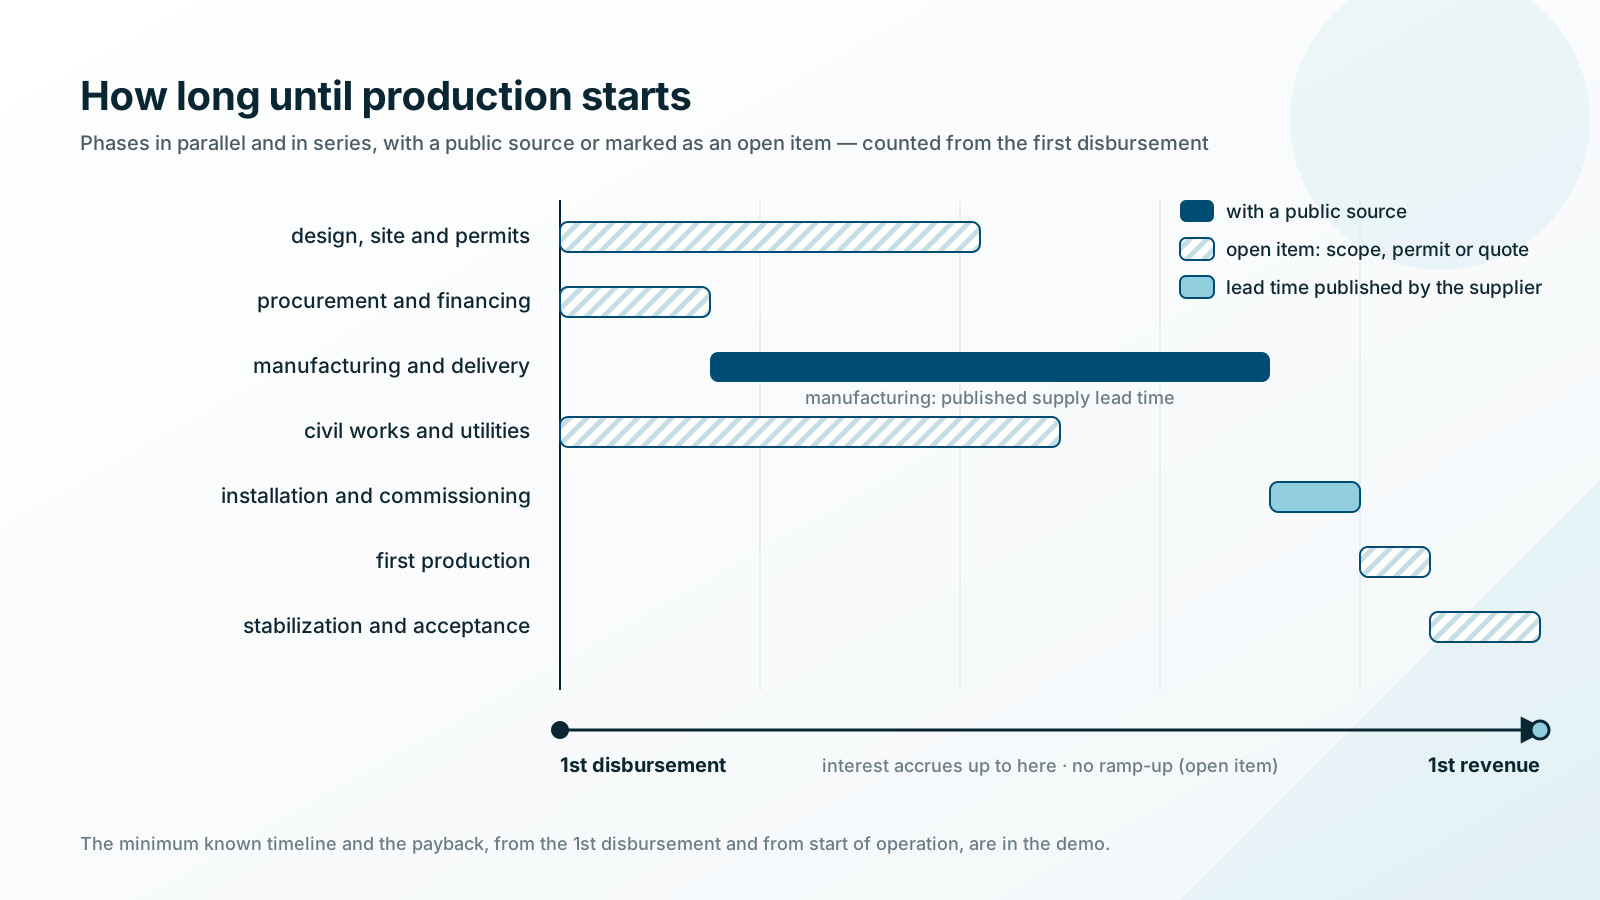
Diagram · numbers in the demo
How long until production starts?
Seven phases per route, what runs in parallel and the critical path, counted from the first disbursement. Durations only where there is a public source; the rest stays as an open item. That is why the total is a minimum, not a forecast. The timeline enters the cash flow: interest until the first revenue, and the payback counted both ways.
-
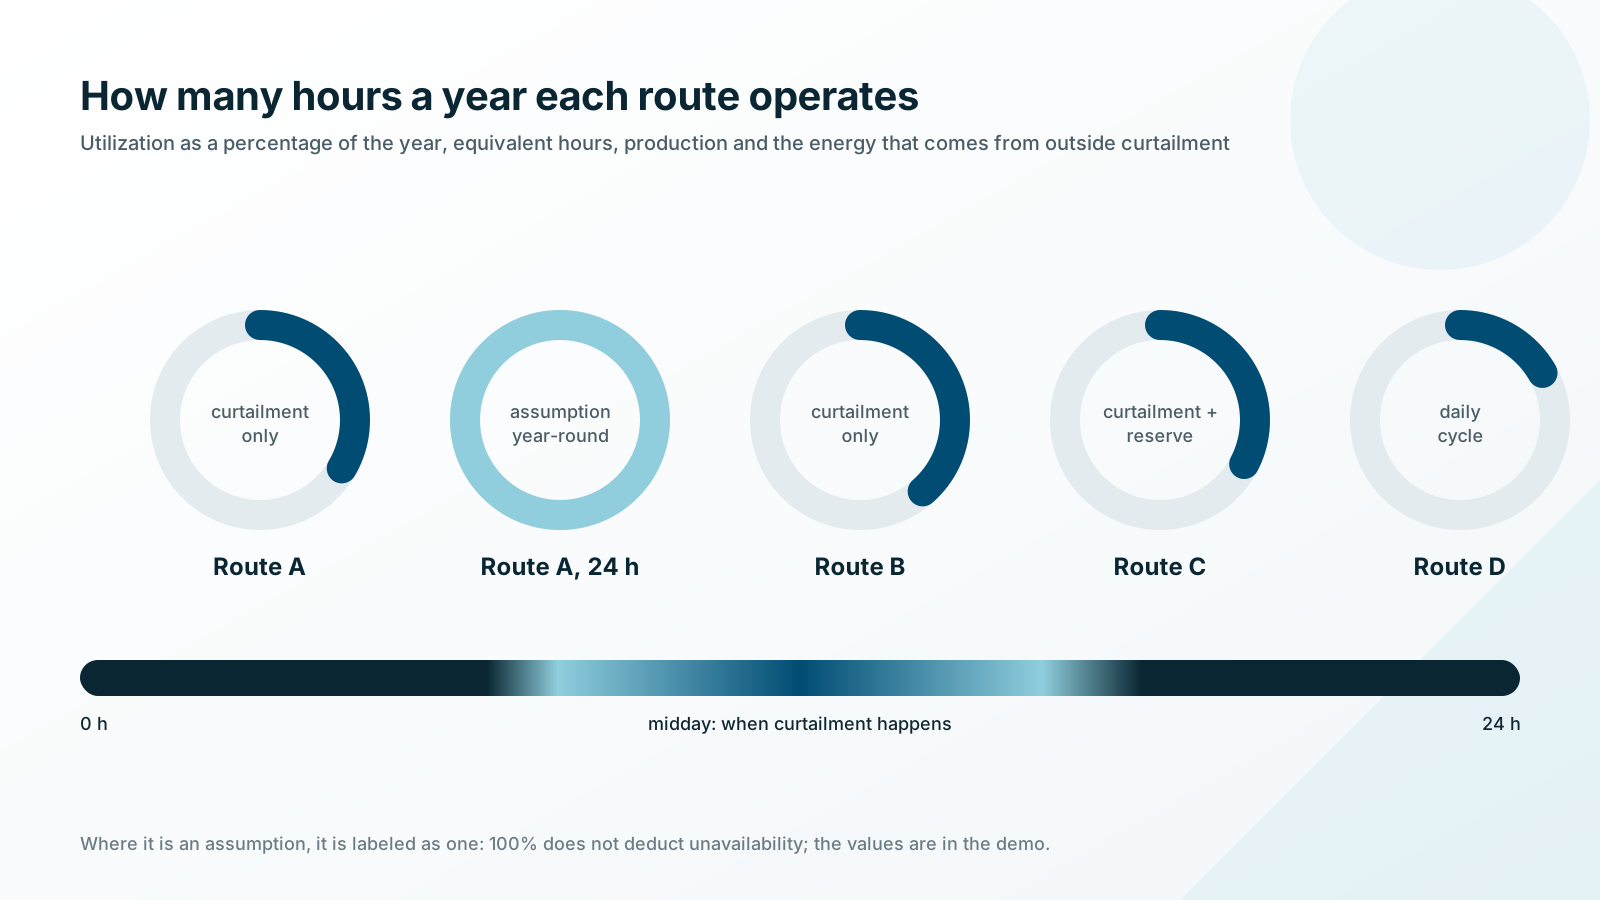
Diagram · numbers in the demo
How many hours a year does each route operate?
Utilization as a percentage of the year, equivalent hours, production and the energy that comes from outside curtailment, by route and scenario. Where something is an assumption, it is labeled as one: the 100% figure does not account for unavailability. Continuous operation of a route depends on a reserve that covers the longest gap in the history.
-
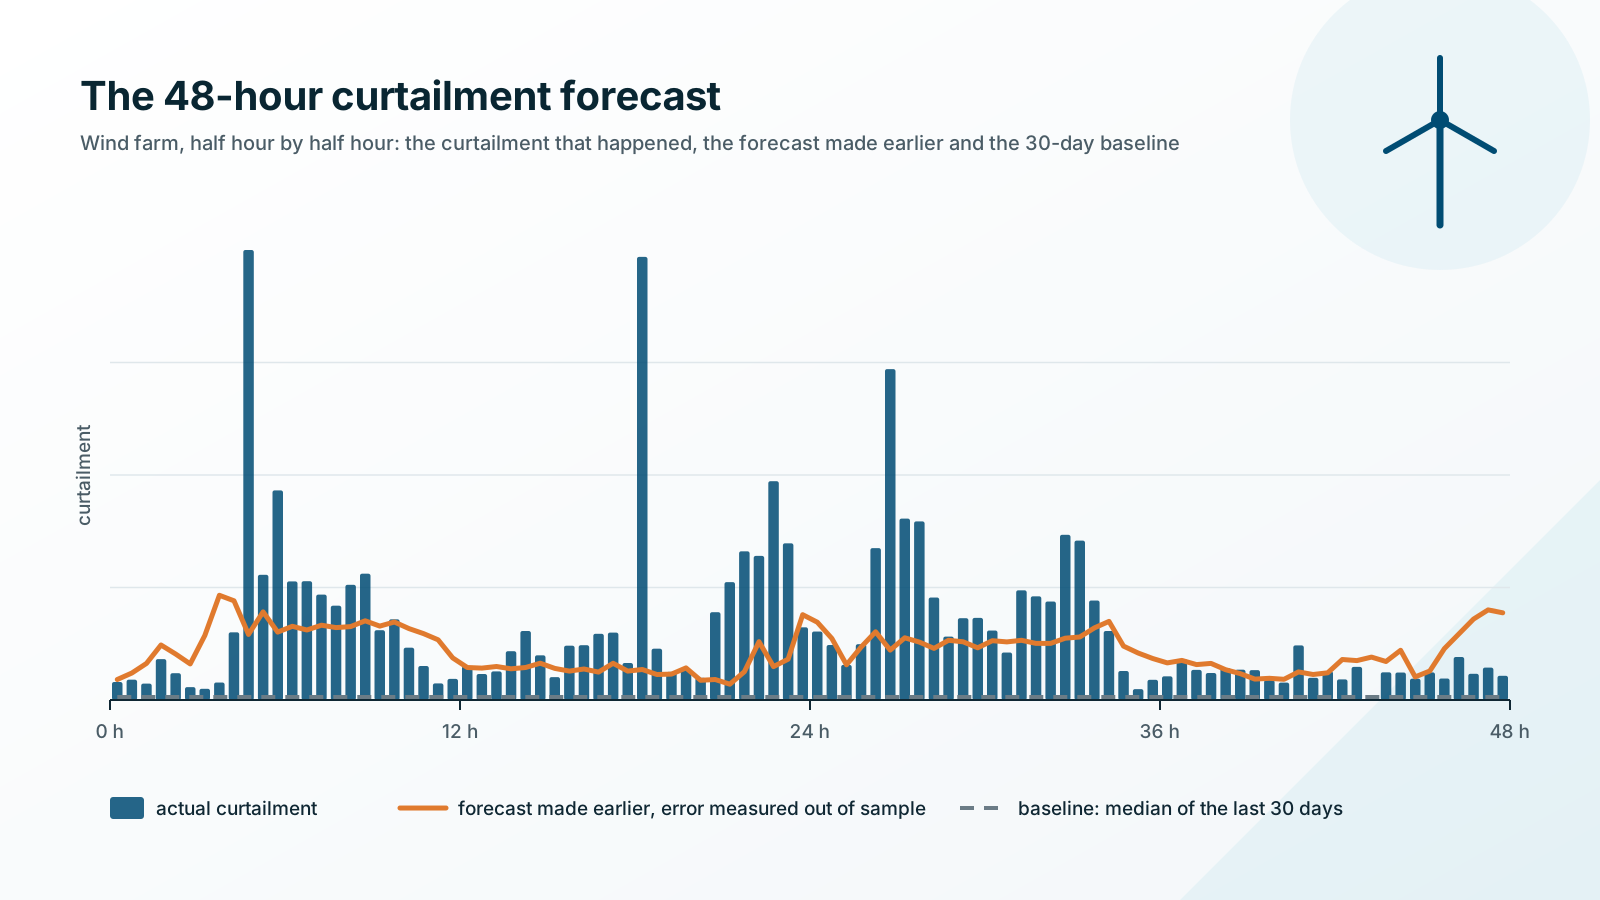
Diagram · numbers in the demo
Is the forecast error smaller than the baseline’s?
Forecast curtailment against actual curtailment, with the error measured out of sample. The scoreboard also shows whether the improvement can be told apart from the baseline — including when it cannot.
-
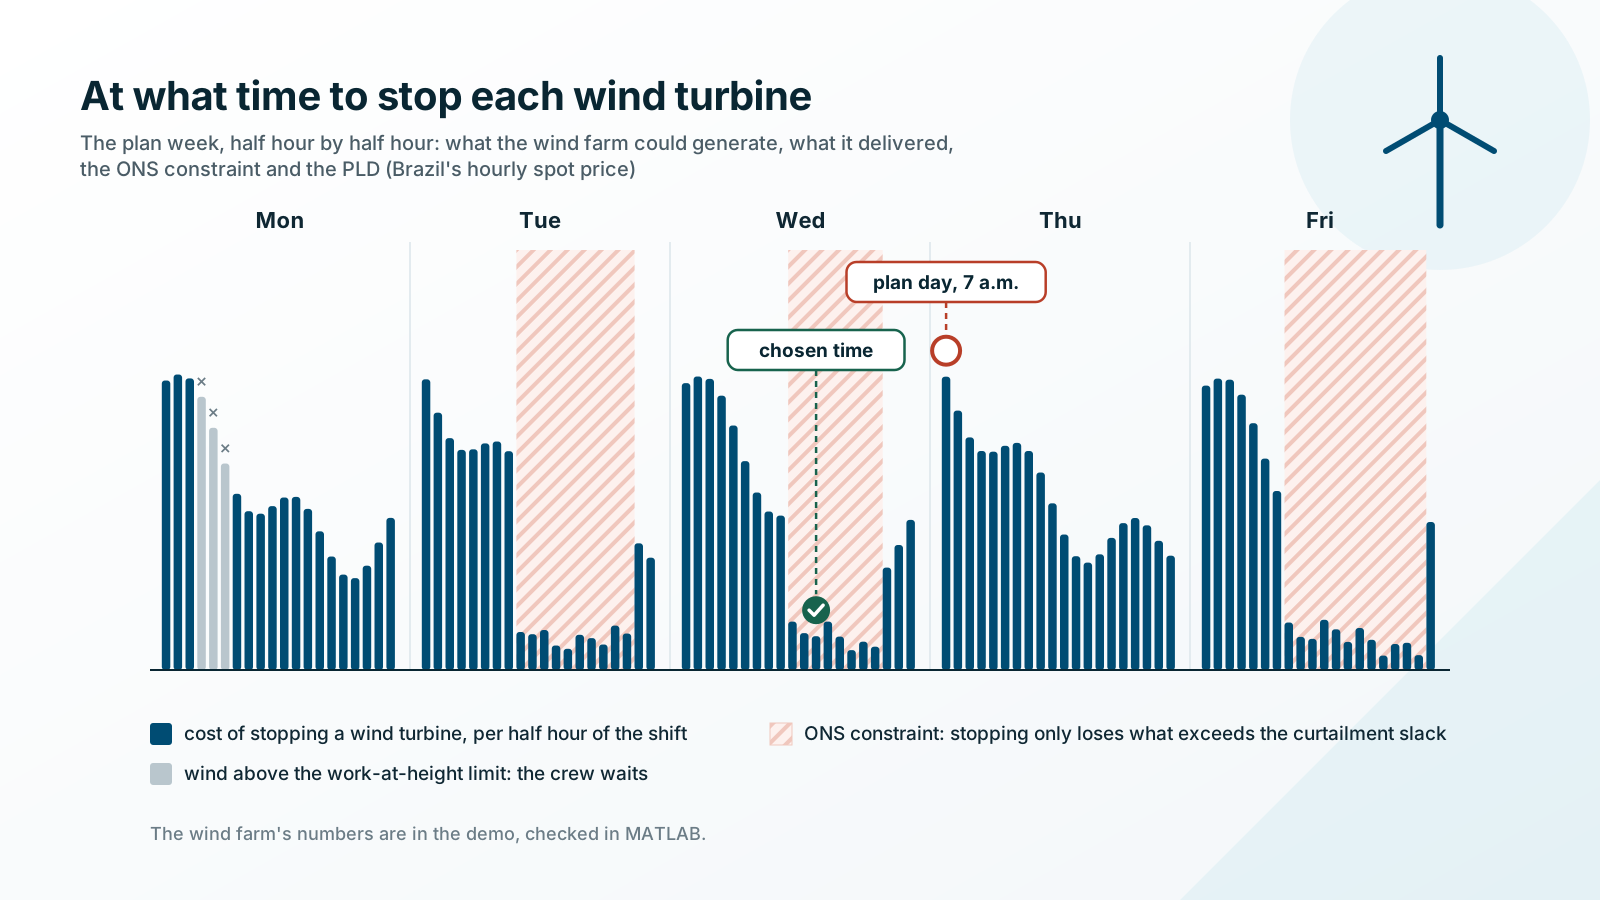
Diagram · numbers in the demo
At what time should each wind turbine stop?
The plan sets the week of the preventive maintenance; the demo picks the day and the time. The cost of stopping comes from the farm’s own public ONS series (what it could generate, what it delivered and whether it was constrained) and from each hour’s PLD. While the plant is constrained, stopping only loses what exceeds the curtailment slack. Three policies with the same visits: today’s calendar, the rule that uses only what has already happened, and the reference with the known curtailments. The calculations are redone in MATLAB and in Python.
-
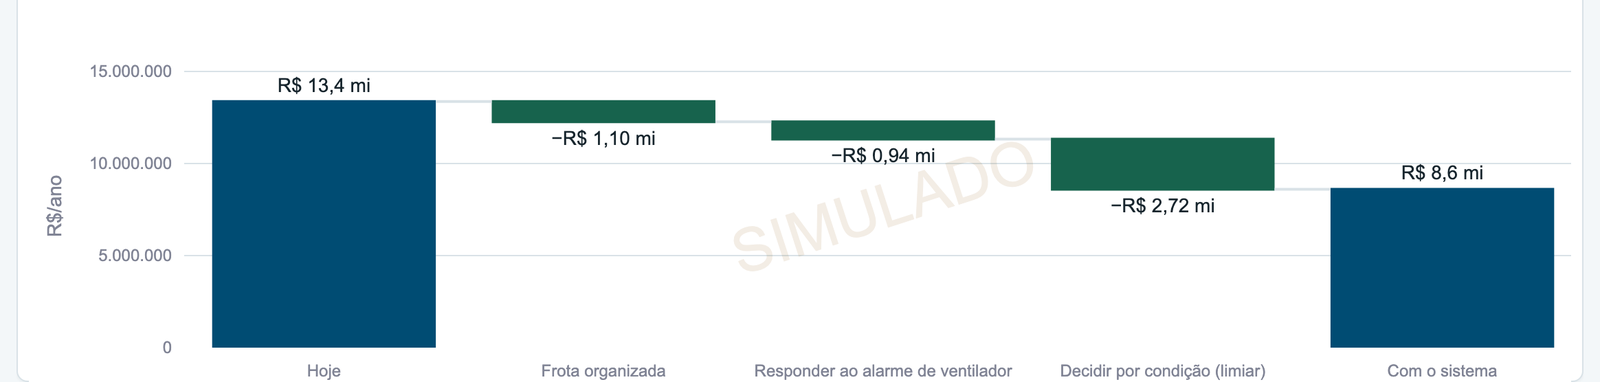
Solar PV demo · screen in Portuguese
How much does condition-based management save, and where does it come from?
A simulated portfolio, broken down into steps: organized fleet, alarm response, condition-based decisions and curtailment forecasting. With a confidence interval. In the wind version, failure rates by subsystem come from the literature, with the source stated. How much condition-based management saves depends on the farm’s failure history.
-
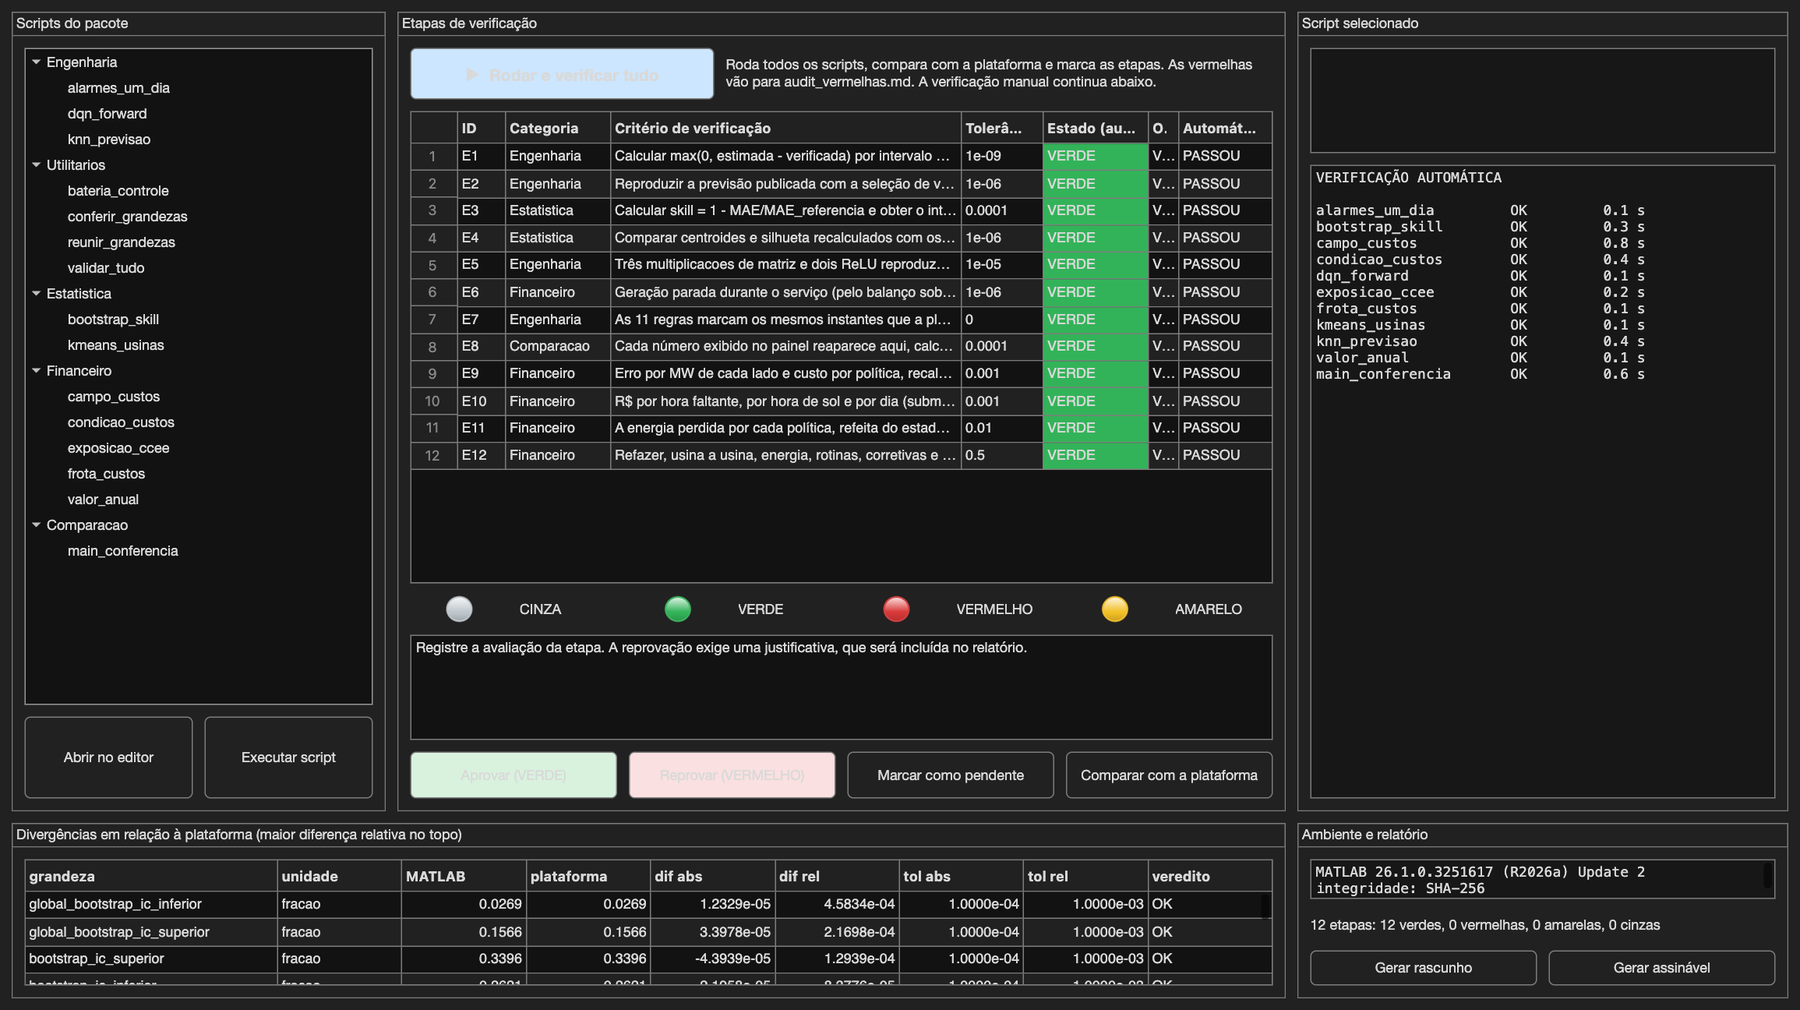
Solar PV demo · screen in Portuguese
Can every number be checked?
Spreadsheets and MATLAB scripts recompute the published quantities. The package states what was recalculated, what uses exported predictions and what is left out of the check.
The check follows the resource: changing the farm does not remove the need to redo the math.
Future opportunity
Storage: the same control problem.
The 2026 LRCAP (capacity reserve auction) contracts power availability. ONS dispatches the battery. The project owner receives a Fixed Revenue (Receita Fixa), and settlement at the PLD goes to CONCAP. The project owner’s job is to keep the asset available, efficient and healthy.
The rule also covers the wind farm: Portaria Normativa MME nº 136/2026 (MME: Brazil’s Ministry of Mines and Energy) contracts storage without distinguishing the generation source. The system can sit at the wind farm’s connection point (art. 4º, § 1º, II) and be used to mitigate surpluses and manage constraints (§ 12). The auctions are on December 2 and 4, 2026.
Outside the auction, a battery at the farm can store curtailed energy and deliver it later. At the wind farm, curtailment is concentrated in the middle of the day, when solar generation floods the grid. At 9 a.m., 96% of the month’s records were constrained, against 25% in the early-morning hours. The battery charges during curtailment and delivers when energy is short.
Portaria Normativa MME nº 136/2026 (opens in a new tab)- charges during curtailment
- delivers when energy is short
Engagement
Serra Pereira does not sell software. We sell knowledge of control and analysis.
What we offer: a cost calculation methodology (investment analysis is one way to analyze cost), IoT and industrial strategies, and above all how to instruct AI so your team can build its own platform.
-
01
Defining the work
The timeline comes after, with the scope in hand.
-
02
The analysis
Where the operation loses money today and the best way to invest. The calculations are redone outside the system and checked against operations. It ends in a number and a verdict, and a no is also a deliverable.
-
03
Your platform
Your team builds it with AI, guided by the method, and it runs in your environment.
How the service works day to day
- Scope, not hours. Agreed deliveries and milestones, with no exclusivity and no tracking of working hours.
- Follow-up. WhatsApp, email and phone, plus recurring online meetings at the frequency the client sets.
- In-person meetings by appointment. Outside the state of São Paulo, travel is paid by the client.
- Infrastructure. The platform runs in the client’s environment. Server costs are paid by the client, and the work adapts to what the client already has.
Use of materials
Scripts, spreadsheets and documentation produced in the work belong to the client.
Pre-existing components and third-party libraries keep their own licenses.
Next step
Talk to us about your scenario.
Bring us your operation’s problem. The wind and solar PV demos use the same method. Access requires a username and password provided by Serra Pereira.
- WhatsApp+55 11 99163-2154(opens in a new tab)
- Phone+55 11 99163-2154
- Emailfabio.serra@
serrapereira.com - LinkedInlinkedin.com/in/
serrapereira-fabio (opens in a new tab)
Fabio Serra Pereira · Mechanical engineer · CREA-SP 5071933433
Back to the Serra Pereira site